Data Analyst turning
transactional data into commercial decisions.
I'm Md Yusuf, a Kolkata-based data analyst focused on revenue, margin and category analytics. I bring 7+ years of P&L ownership from Events and Manufacturing into a business-first analytical lens — every model starts with the decision it needs to change.
Experience
7+ years across analytics, event operations and manufacturing — P&L ownership, vendor negotiation and revenue accountability.
See work history →Projects
End-to-end analytics builds spanning SQL, Power BI and Python — from star-schema retail models to fraud detection dashboards.
See case studies →Skills
A commercial analytics toolkit: SQL data modelling, Power BI/DAX reporting, Python EDA pipelines and financial spreadsheet work.
See toolkit →Active Work
Experience
- Built a production-quality merchandising intelligence system on ~50K rows — 6 SQL queries, star schema, 5-tab Power BI merchant dashboard.
- Designed a 5-page Power BI fraud detection report with drill-through across 10,000+ transactions, cutting review effort by ~40%.
- Delivered an end-to-end Python → SQL → Power BI e-commerce pipeline on 400K+ rows, identifying 5–12% margin improvement potential.
- Owned P&L across 50+ large-scale events with full revenue forecasting accountability.
- Built Excel and Power BI financial tracking models that reduced vendor costs 12% year-over-year.
- Ran operational dashboards tracking lead-to-deal conversion, event ROI and client retention.
- Built Excel dashboards tracking output trends, defect ratios and machine downtime.
- Standardised reporting improved on-time completion by 8% within one quarter.
- Applied Lean/Kaizen principles to prioritise improvements by cost impact.
Core Competencies
🗄️ Data Querying
📊 Visualization & BI
🐍 Python Analytics
🧮 Spreadsheets
🗃️ Commercial
⚙️ Industry Context
Case Studies
RevenuePulse:-SaaS Revenue Intelligence
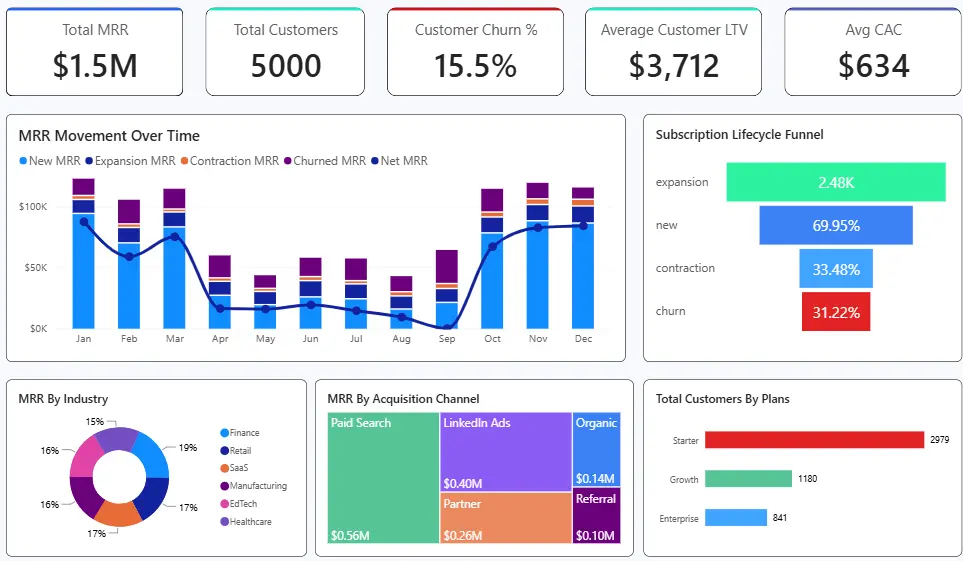
Delivered end-to-end SaaS revenue intelligence that surfaced expansion, contraction and churn drivers across 5K+ customers, enabling clearer ARR and retention decisions. Built with SQL, Power BI and advanced DAX covering MRR, ARR, churn, cohort analysis, CAC, LTV and executive KPI reporting.
MerchIQ:- Retail Merchandising Performance
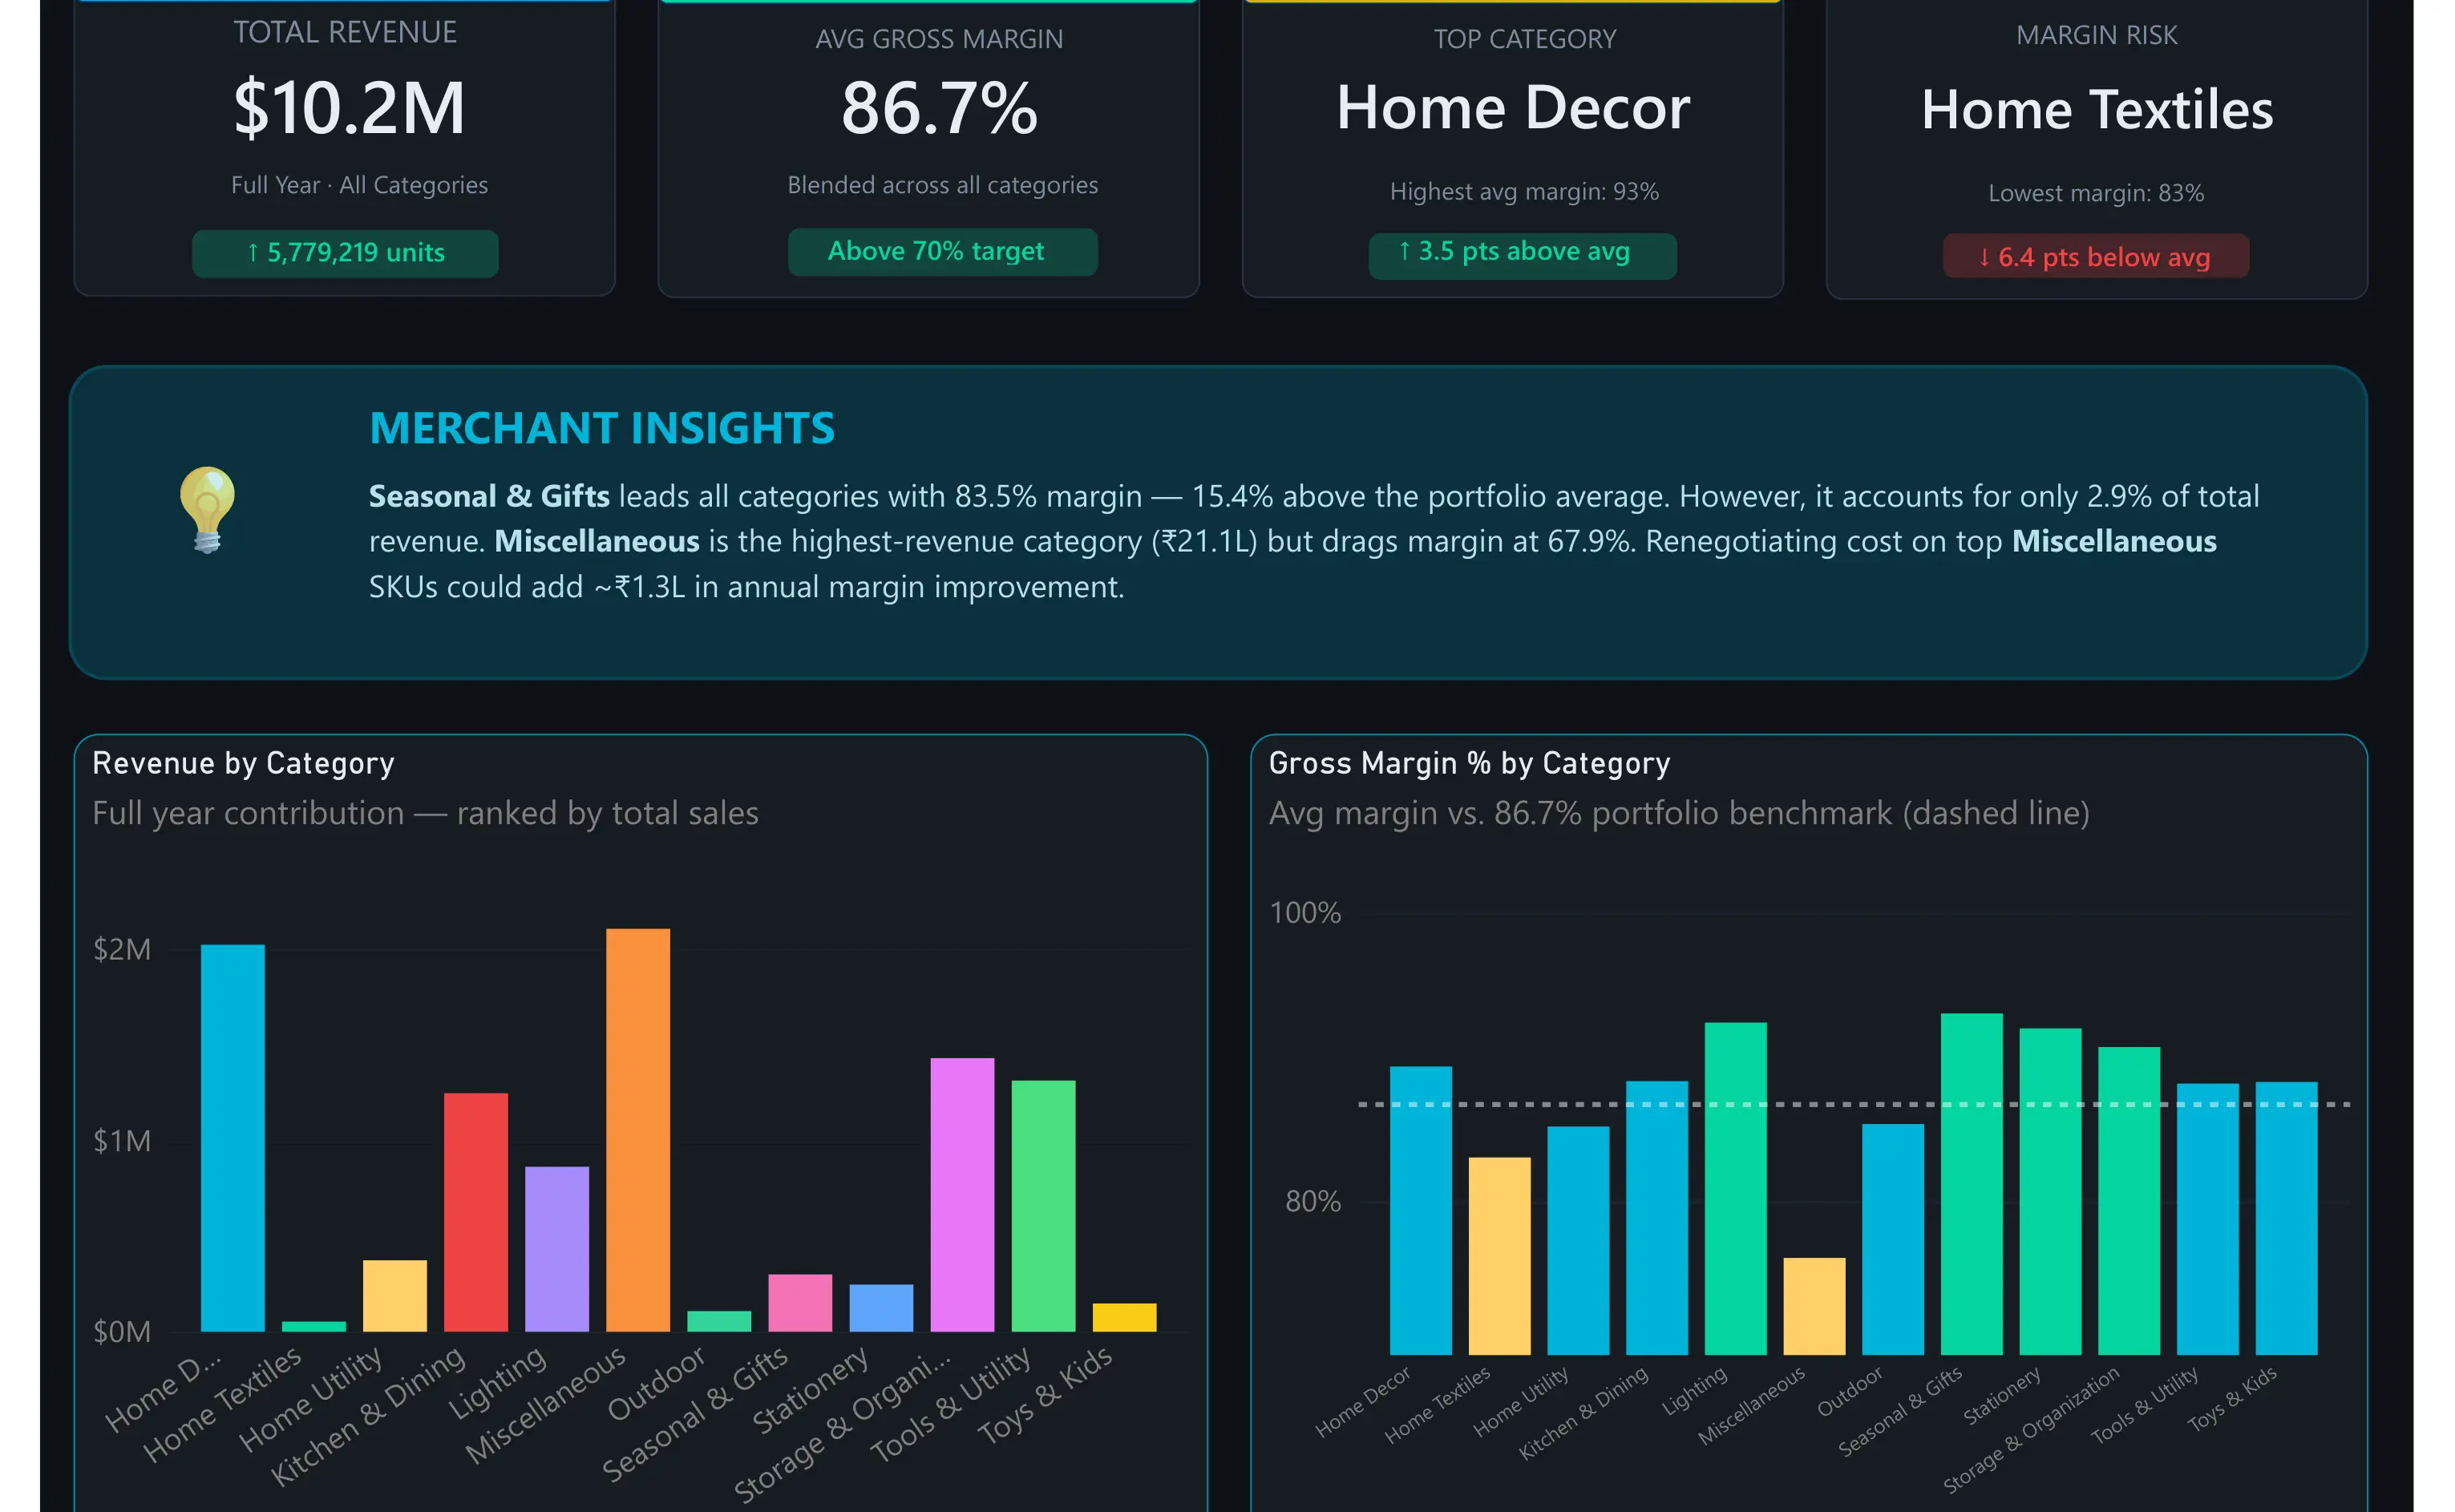
Built a full merchandising intelligence system on 525K+ transactions that gave decision-makers clear visibility into vendor performance, promotional lift and stock health across 38 countries. End-to-end retail merchandising analytics with star schema modelling, vendor analysis, promotional lift evaluation and merchant dashboards.
CommerceCore:- E-Commerce Data Intelligence Pipeline
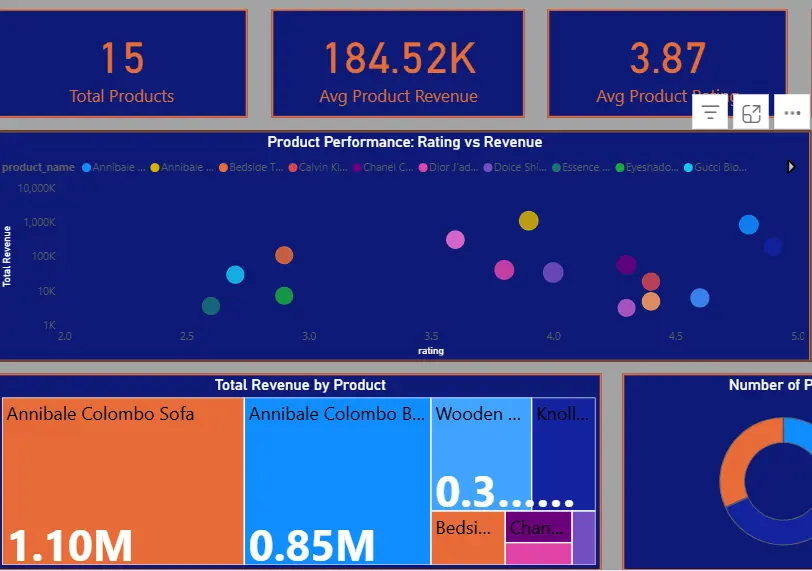
Uncovered 65–70% revenue concentration risk in top categories and cut time-to-insight by ~30% through an end-to-end ETL + Power BI pipeline on 400K+ rows. Consolidated multi-source e-commerce data and delivered KPI dashboards (Revenue, AOV, Orders) with clear margin and concentration insights.
RiskSentry- Financial Risk Monitoring Fraud Intelligence Dashboard
Reduced fraud investigation time by 40% and helped risk teams focus on the 0.17% of transactions that mattered most, cutting false positives and potential losses. BFSI-focused monitoring system that flagged anomalous patterns across 284K+ transactions with concentration risk analysis.
ValueTier- RFM-Based-Customer Segmentation For Targeted Marketing
Identified high-value customer segments from 150K+ transactions, enabling more precise targeted marketing and improved retention focus. SQL-driven RFM segmentation framework that grouped customers into 5 clear tiers for marketing and CRM actions.
OccuRate- Revenue Intelligence For Indian Hospitality Industry
Gave hospitality operators clear demand and pricing signals across 982 hotels and 10 cities, supporting better occupancy and revenue decisions. Market-level exploratory analysis of demand patterns, pricing sensitivity and room-category performance.
LedgerView- Automated Sales MIS Inventory Performance Dashboard
Automated sales and inventory reporting across 100K+ transactions, replacing manual MIS work and giving faster visibility into market and product performance. Excel-based management reporting solution covering sales, inventory and operational KPIs across 4 markets and 4 product categories.
The Person Behind the Data

Md Yusuf
A business-first analyst with a B.Tech in Automotive Engineering and a Smart Data Analytics certification (Distinction) from Aptech, backed by IBM and Cisco credentials. Prior to analytics, I spent 7+ years in operational leadership across events and manufacturing — owning budgets, vendor costs and revenue outcomes. That commercial grounding now shapes how I approach every dataset: as a decision to be made, not just a metric to report.
Education
- Data Analysis with Python (Pandas, NumPy, Matplotlib)
- SQL & Database Management (MS SQL Server)
- Power BI — DAX, Power Query, Dashboard Design
- Statistical Methods & Predictive Analytics
- Business Intelligence & KPI Reporting
- Mechanical Systems, CAD/CAM Design
- Manufacturing Processes & Quality Control
- Industrial Engineering & Operations Research
- Business Analytics & Decision Sciences
Certifications
Data Analytics Essentials ↗
Enterprise Data Science in Practice ↗
Machine Learning for Data Science ↗
SAS SQL Essentials ↗
Data Analysis Using Python ↗
Creating Compelling Reports ↗
Contact
Let's Connect
Whether you’re hiring for a data role, exploring a collaboration, or simply want to talk through a commercial analytics challenge, I’d be glad to connect. I bring a decision-first approach shaped by years of P&L ownership across Retail, Hospitality and Manufacturing believing that clear data can drive better revenue, margin or operational outcomes. Feel free to reach out if you’d like to discuss a project, review a use case, or explore how analytics can support the decisions that matter most to your team.
Email Me